 Sean Clark
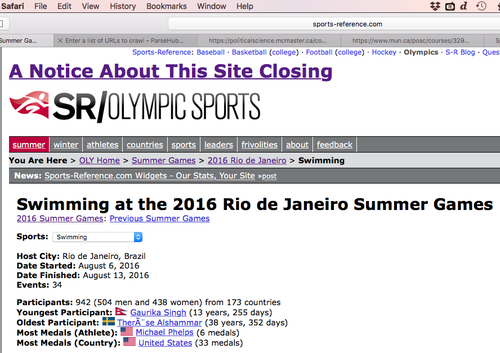
Sports Reference.com has an excellent (though presumably soon-to-be-extinct) Olympics database. The data contained there is incredible--an even more detailed look at Olympic results than David Wallechensky's indispensable Summer and Winter Complete Book compendia.
I've wanted to take a closer look at fatigue and average pace curves for swimming. This follows some running prediction work I did a while back based on Peter Riegel's 1981 "Athletic Records and Human Endurance" article in American Scientist. Plus, I always wanted to try out web scraping. So when I came across the easy-to-use scraper ParseHub, a good match of objectives was found.
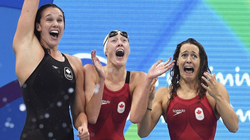
(Photo is of the Canadian women's 4x100m freestyle relay celebration, after their bronze medal finish--one of my favourite races at Rio. By the CP's Frank Gunn, published in Maclean's.)
Data Collection
The details are contained in my ParseHub post, but the basic data collection story is that I used ParseHub to start on the Sports Reference.com main Rio swimming page and then automatically harvest the top-8 results for every event.
I did a little supplementary cleaning, but the data harvested looks something like this:
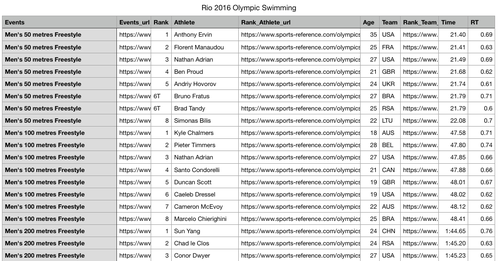
A copy of the data is available here:
Once harvested, the data was ready for export into Stata (my statistics program of choice, but any program would work fine).
Stata Clock Time
Anyone who has worked with Stata a bit knows it treats date and time data in a specific format (everything is zeroed in on the number of milliseconds before or after January 1, 1960). I've worked with dates quite a bit, but haven't spent much time working with duration, at least down to minutes, seconds, and hundredths of a second.
Two things to keep in mind if you're doing similar analysis:
- Make sure your time string has 00: covering each of the hours/minutes/seconds you need.
- By this I mean how the results from the scrape here brought in final times ranging from 21.40 (seconds and hundredths) for 50s, to 1:44.65 (minutes / seconds / hundredths) for 200s, to 1:52:59.80 (hours / minutes / seconds / tenths) for the 10km.
- The implication is that your time string should look like:
- 00:00:21.40 for the 50s.
- 00:01:44.65 for the 200s.
- 01:52:59.80 for the 10ks.
- Again, the rationale for all the zeroes is that since my data includes hours (the 10km races), my 50s need to include that data (that the race was 0 complete hours in length) if my time calculation commands are to work.
- When you're dealing with the de-stringed duration variable you'll also notice the times all include reference to January 1, 1960. Don't let this sidetrack you; this is simply the way Stata clock (%tc) values work. It's merely a calculation convention and doesn't in any way impact your work with the values. You can in fact ignore the fact that Stata assigns a particular day to the value.
- The code will look like this:
- gen double time2 = clock(statatime, "hms")
- format time2 %tc HH:MM:SS.ss
2. Velocity (m/s) calculations require a new 'elapsed seconds' variable,
which (at least with the Stata skills I have) is a lot more
complicated than I assumed.
The basic strategy is that you'll need to pull out the hours, minutes,
and seconds, then sun manually.
The code for this is:
- generate hour = hh(time2)
- generate minute =mm(time2)
- generate sec = ss(time2)
- generate elapsed seconds = sec + (minute * 60) + hour * 60 * 60)
With these lesson in mind, you'll have no troubling working though any similar type of analysis in Stata.
Data Analysis
With the data cleaned to satisfaction, I put together a few charts based on the harvested information. The main ones follow.
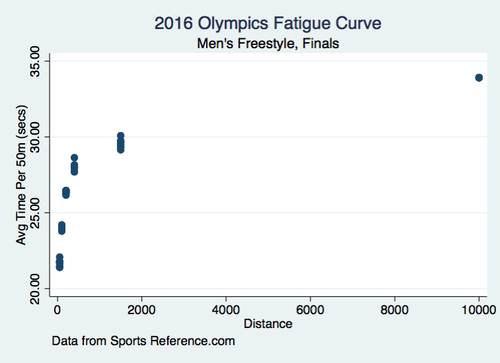
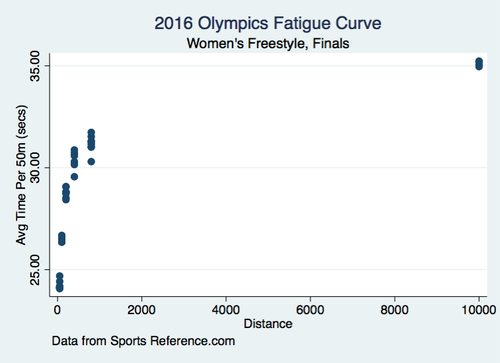
I started with the average 50m pace times for each top-8 finalist in each Freestyle event (50m, 100m, 200m, 400m, 800/1500m, and 10km open swim).
If you've ever spent much time in the pool you'll appreciate how crazy it is that the 1500m finalists average 29.6 seconds for each and every 50. That's incredible endurance.
As for the 10k open-water swimmers, they hold 33.9 seconds for a distance longer than most distance workouts!
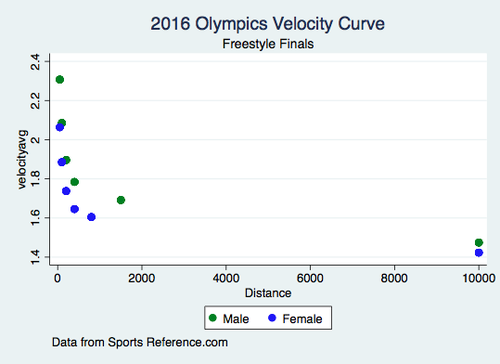
One thing that interests me is how the the pace gap between men and women shrinks as race distance increases. The average male 100 Fr pace was 23.97 seconds, while the female 100 Fr was 26.52 (= 2.55 sec difference); for 400 Fr the split was 28.03 vs 30.38 (= 2.35 sec). But by the time you hit 10km, the gap falls to just 33.91 vs 35.13 (= 1.22 sec).
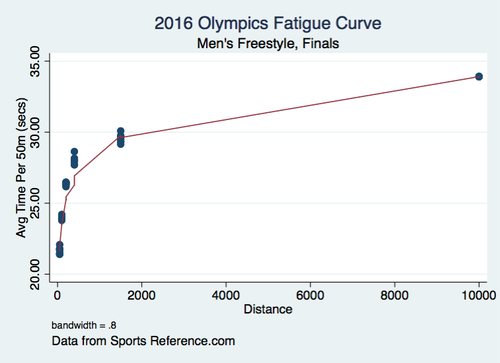
Next, to give a little sense of the non-linear shape of the fatigue curve, I drew the men's results with lowess smoothing:
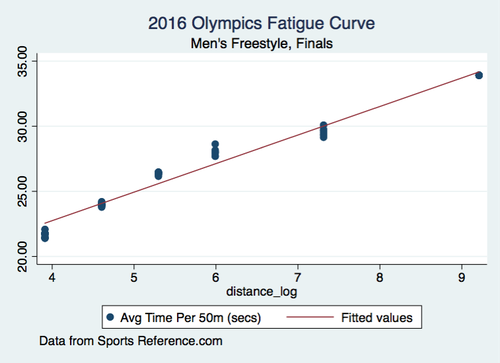
Also because of non-linearity, I calculated the log values for distance and average pace, and plotted them as well:
To get a clearer sense of how speed drops with distance, I calculated average Finals velocity and plotted it for each event. Here both male and female events are on the same graph.
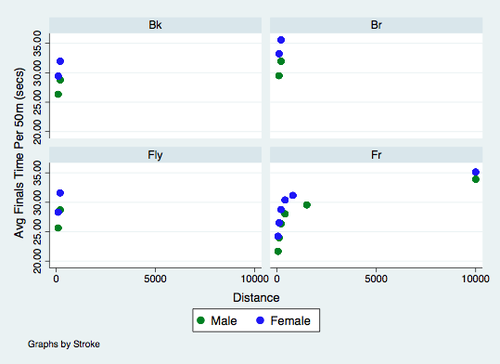
Lastly, I plotted the pace curves of the other strokes as well. (I could have done the IM too, but a 2x2 table is probably all we need here).
For the uninitiated, the standard Olympic event lengths for Breaststroke (Br), Backstroke (Bk), and Butterfly (Fly) are 100m and 200m.
The gender pace gaps appear pretty standard--but again, as shown in the bottom right corner below--there is movement towards convergence in the ultra-endurance Freestyle event.
Conclusions
The purpose here was three-fold:
- An excuse to learn how to do web scraping using ParseHub.
- Digging in and playing around with Sports Reference.com's Olympic data (which appears to be living on borrowed time). And...
- Spending a little time working through how Stata treats duration values, which doesn't seem to get a lot of treatment in the how-to manuals and comment boards.
As an added bonus, the work here expands upon Riegel's 1981 piece mentioned above, incorporating ultra-endurance swimming data not included in his work:
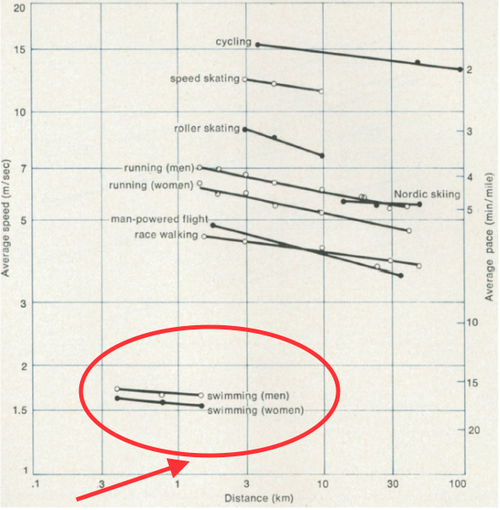
The work here extends, in other words, Riegel's swimming lines out to the ultra-endurance range--a distance where it appears the gender gap in pace performance falls dramatically.
A result definitely worth further consideration!
Statistical Addenda
For anyone looking to reproduce this or undertake similar work, my Stata .do and .dta files are saved here:

Write a comment