 Sean Clark

In Canada we are fortunate to have pretty good polling data on our leading political parties, even at the regional level.
Inspired, I imagine, at least in part by the success of the (somewhat mercurial) Nate Silver and his 538 project in the United States, bloggers like P.J. Fournier at 338Canada and Curtis Fric (supported by everyone's favourite Saskatchewan cartographer, Alex McPhee) at Polling Canada have done an excellent job of keeping tabs on the rise and fall of political popularity in Canada.
We are also well served by Éric Grenier and his work predicting election outcomes, both at his old blog (ThreeHundredEight.com), the CBC, and now his Substack, The Writ.
Playing with Polling Data
While putting together a draft proportional swing model (discussed by Grenier here), I downloaded the full polling dataset collected by Polling Canada. Available here, I can't say enough about this dataset. The breadth is pretty incredible, as evidenced by the "Federal Timeline" page:

In any case, my purpose here is to do more than pump tires. The database is so great my recommendation is to download the work and play around with it. I've done some of this myself and have come up with a least a few things to think about.
Good Times, Old Governments
One of the first regressions I ran was to compare incumbent popularity (measured in polling support) with my economic history dataset (seen elsewhere on this blog and material that runs back to 1961) and calculated government age. No surprise here, as years where real GDP growth is good seem to help the government in power (a coefficient of 0.162). Yet each year that passes for a Prime Minister in office wears down their polling numbers (-1.788). Old governments in Canada clearly have a rougher go.

I wondered what a more individual-focused look at economic conditions would do to the model, so I regressed the national unemployment and inflation rates against government popularity, once again alongside government age (as defined by the number of years the Prime Minister has spent in power).
The results took me by surprise, as they were entirely counterintuitive. We can reject the unemployment relationship (coefficient of plus 0.138) as it is statistically insignificant. But the inflation result (coefficient of plus 0.770) meets the standard significance test and more. In other words, increasing inflation is associated with increased government popularity--at least in the data considered here.

Following down this path a little deeper, I took at look at the relationship with 'pain', a common measure comprised of the unemployment and inflation rate combined. Here again the result is the opposite of what I expected: increasing pain is statistically associated with increased government popularity (even while government age will grind it down).

Viewing the relationship graphically reinforces the idea that the Canadian public is pretty impervious to hard economic times, at least vis-a-vis their thoughts on the government in charge:
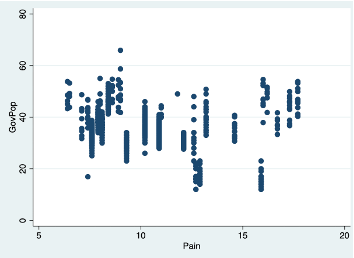
A more confident conclusion would take more rigour than employed here. But the results are novel--certainly a departure from what I had imagined beforehand--and may speak to the fact Canada has had plenty of rough economic history. This has not only left us with a wealth gap compared to our US neighbour, but may have left the country with a more hardy and economic fundamentals-resistant electorate than classical theory would assume.
Going forward, the Polling Canada data runs back all the way to the 1940s, so it would be interesting to splice the dating-back-to-1961 IMF/World Bank data in my economy collection with the StatsCan Historical Statistics publication and push the analysis even further back in history. A broader, more expansive model would also allow a deeper dive into potential causal pathways.
But in the meantime, I take this as a further example of how you can uncover interesting relationships through the research and hard work of others.

Write a comment