 Sean Clark
The NBA season is about to start and so I thought I'd write a blog post detailing my adventure setting estimated win totals for the upcoming season.
This is a fun project because it gets you thinking in a disciplined way about the prospects of your favourite team and others.
An added bonus is addition of an element of competition, since the odds makers are happy and eager to publish their own results from their much more sophisticated (but not necessarily exceedingly more accurate) models.
My basic approach is to sum a forecast of a team’s adjusted +/- into an aggregate total, then use Daryl Morey’s application of Bill James’ Pythagorean Wins estimate to determine how many wins each team will come away with over the season's 82 games.
This approach isn’t perfect because +/- is built at the player-level rather than the team (unlike metrics like ORtg and DRtg), but it certainly serves my purpose of thinking more rigorously about basketball and so I figure the concept has some use.
Methodology
There’s plenty of different ways to go about this, so I won’t get too bogged down in the details. But the basic approach I followed is:
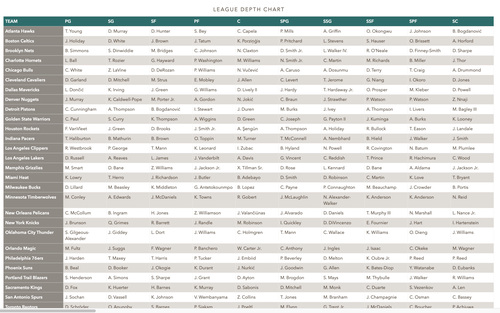
1. I pulled out the starting 5 and first sub at each position from ESPN Depth Charts:
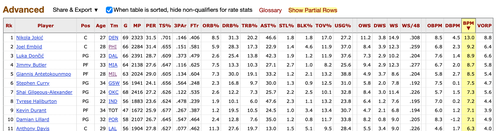
2. I looked up the offensive and defensive Box Plus-Minus (BPM) from Basketball Reference:
3. I projected this year’s values by inflating T-1 BPM for each player by (admittedly arbitrary) Talent, Coach, and Culture adjustments. Rookies were generally given a value of -2.0, which is the value of a replacement-level player. Ad hoc adjustments were made in a few cases where I thought additional adjustment was necessary (ie Wemby).
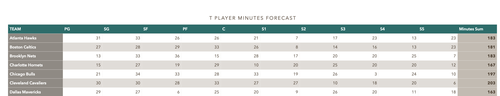
4. I built a minutes forecast primarily on T-1 data (with some adjustments for injuries, load management, etc), when normalized it across the 10 players so that the total minutes played = 240 per game.
5. Multiplying the forecast OBPM and DPBM values by the forecast minutes gave me an aggregate adjusted sum. Adjusting this by pace (to take the per 100 possessions BPM metrics and provide a per-game level output; mostly I just use the T-1 value) and adding the league average score (here I relied on the T-1) gives me a per game value for points for (using OBPM) and points against (DBPM).
6. Plugging points for and against into the Morey/James Pythagorean formula provides win expectations. I also normalized the Pythagorean results to equal the NBA season’s 1,230 total wins (otherwise I’d have more wins and losses than the schedule allows). This isn’t an ideal step, but the alternative is to use Excel’s Goal Seek to set the exponent to a number that provides the proper total. This can be done pretty straightforwardly, but for now I don’t want to depart too far from Morey’s 13.91 value (though already 538 and others depart from it slightly).
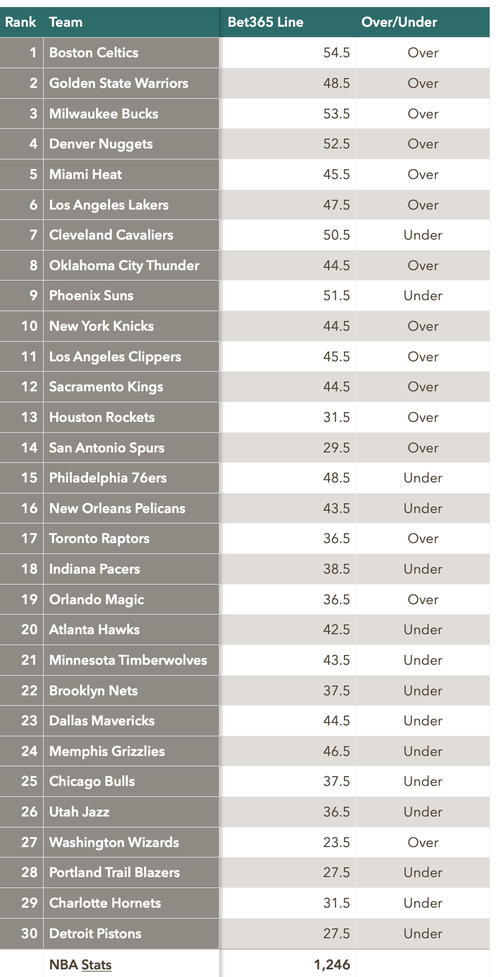
7. Comparing these win totals against the Over/Unders set by the sharps gives a good target to aim at:
Lessons Learned
A few thoughts that came out of this process:
* It would sure be great if all the different data sources (NBA, Basketball Reference, ESPN, etc), use the same nomenclature (eg PHI vs PHL). Data cleaning is a pain, especially in a spreadsheet rather than coding (like Stata) environment.
* Bill James’ Pythagorean tool is incredibly handy. And shout-out to Wayne Winston for making all of this business understandable.
* Working through the numbers helps you think clearly about simple applications of the model. One of my favourite revelations is how a slower pace makes sense as a *strategy* for bad teams. If things go sideways every time you touch the ball, don’t chuck but clog things up and try to stop the bleeding.
* BPM is -2.0 for a replacement level player. The implication is that this is a star-heavy league, where top talent is *expected* to to light you up--but you can still stay in the league if you limit the damage.
* I clearly don’t think enough about how minutes profiles matter. Tinkering with the model shows that if you take away minutes from even an incredibly stacked team and you have real problems. This is also a good way to think about how young can outperform old, how we probably don’t assign enough weight to how catastrophic injuries are to team’s fortune, etc. Good minutes aren’t everything. But they’re almost.
In any case, if you have a bit of time, interest in stats, and love of basketball, this is a good project for you to try out on your own.
Happy modelling!
Addendum
With the season now over, we can take a quick look at the results. Below is a table that summarizes actual league results for the year, then compares them to the predictions mades at the beginning of the season:
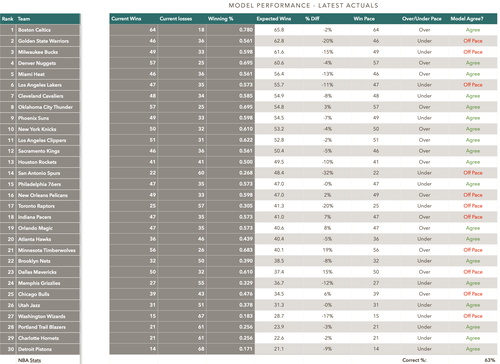
We can blame my overeager Spurs prediction on being a homer (and Pop's terrible Jeremy Sochan-at-point guard experiment). I did legitimately think the Warriors and the Lakers would be much better than they turned out to be, though. I find those disappointments still a bit inexplicable--other than of course age.
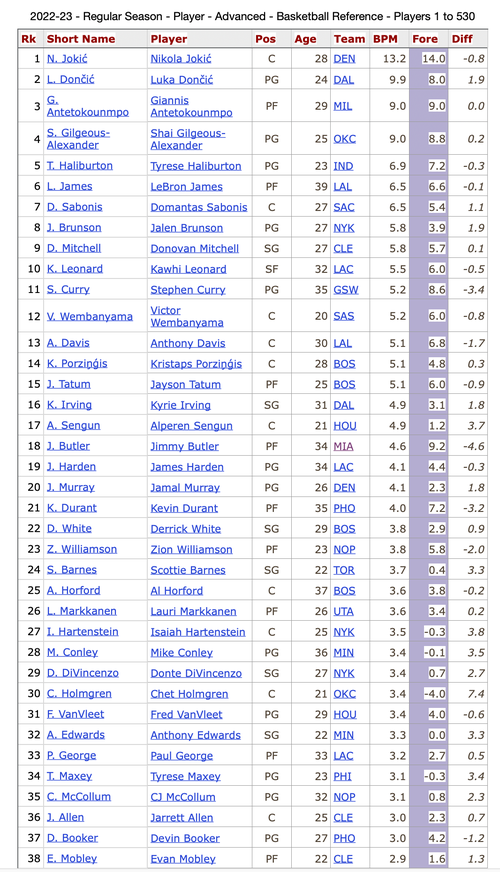
It's also worth posting my player predictions, since the underlying model relied on the BPM values of the 10 main rotation players for each team. This table shows the actual results against my forecast, then the difference between the two:
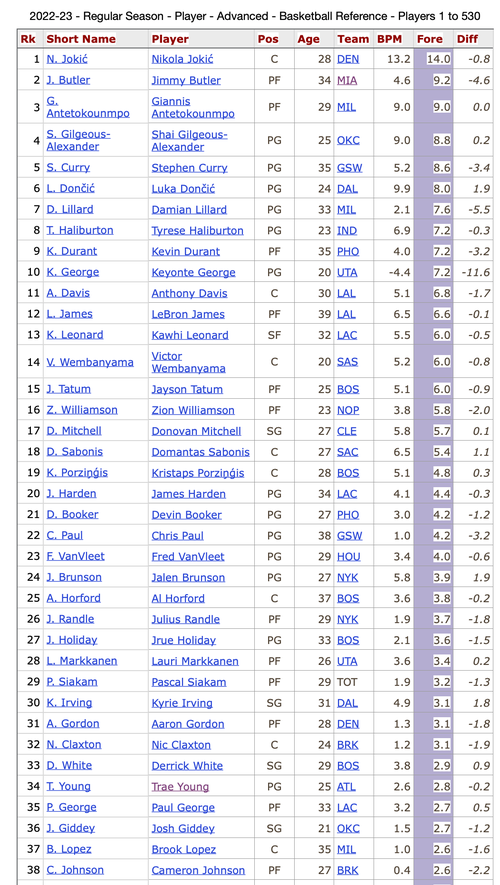
To put my predictions in a little better context, here is the same table but sorted according to my scores. The chief implications being Jimmy Buckets played way worse than my estimates, Giannis and Jokic being pretty much as expected, Curry a bit worse, and my pretty seriously underestimating Luka and Brunson:
Last, though I feel 63% is a pretty decent result for the first time out, I was looking for a bit of perspective on this performance. My first thought was to look at the annual NBA over/unders on the Bill Simmons podcast (Simmons, Ryen Russillo, and Joe House participating). Shout-out to Reddit contributor mr_irony for posting this table:
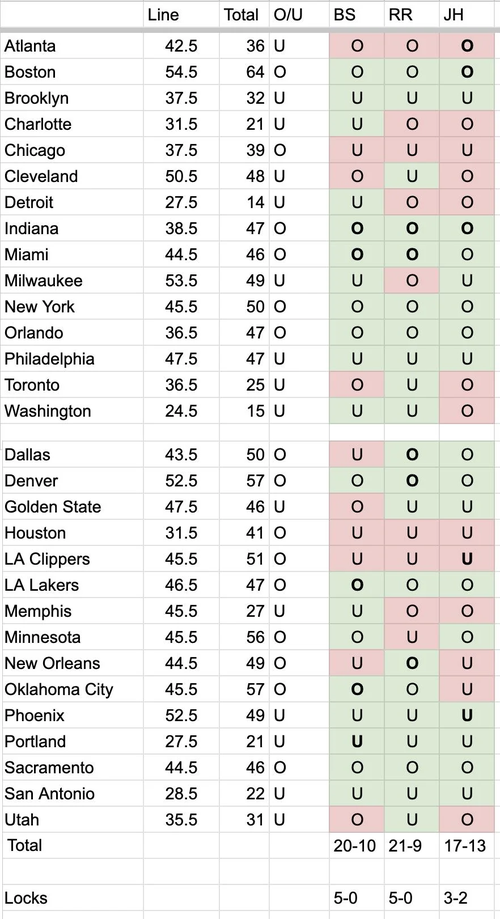
These results translate into 67% for Simmons, 70% for Russillo, and 57% for House. So I still have some improvement to make!

Write a comment